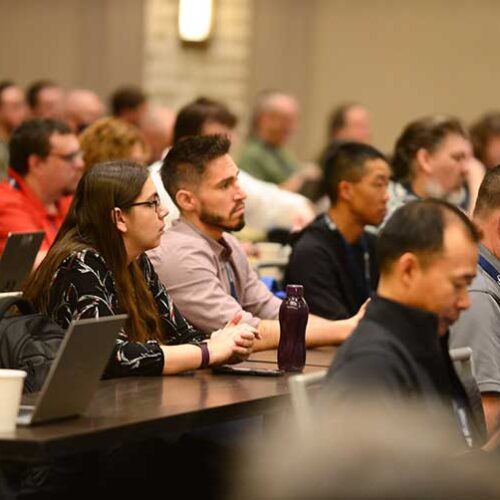
Events range from topic-specific webinars to large community discussions, where the community gathers to collaborate and share.

Events
Convening the Community
Webinars, workshops, training sessions, and community gatherings all fit within our mission of supporting and expanding the community.
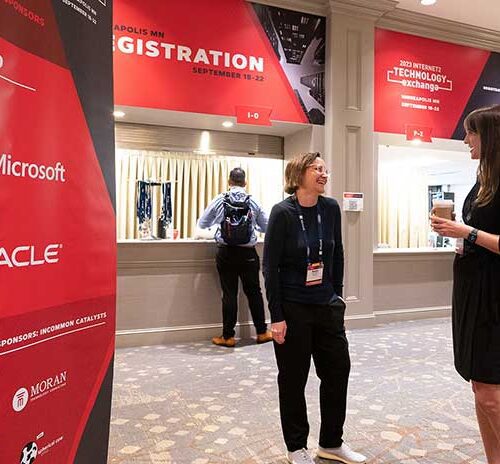
The 2024 Technology Exchange Call for Proposals is open! TechEX24 is slated for December 9 – 13 in Boston, Mass.
Also, check out our video page to recapture 2024 Internet2 Community Exchange highlights.
Upcoming Events
There is so much to look forward to when it comes to Internet2 events! Explore the full slate of upcoming virtual and in-person events.
Past Events
Did you miss an event? Looking for event recordings? We’ve got you covered. Access videos from our extensive playlist.